Human Computer Interaction

The Study of How Humans Interact with Computers

The purpose of HCI studies, is to assist in the development of systems that provide a positive user experience. That can't be done without involving the user at the initial stages of a new product or software.

The principles and processes of HCI are now emerging into other industries in both a digital and physical realm. Implementing HCI processes in developing products and devices for a target user groups, saves the organization time and money. HCI involves all interactions between different user groups. Accessiblity Design is a critical aspect of HCI.

My HCI research practices incorporates accessibility practices. This is a part of the CX Design research to ensure that all consumers of a product or service have an equally positive exerience.

Research graphic.

My Process

What I do as an HCI professional.

I am often asked, what is my process from conception to execution. Ideally, I enjoy using Atlassian software, which allows me to collaborate with the development team to assist in the transition from flat design, to coded design. When Atlassian is not available I have customized the incorporation of systems such as AXURE and Trello to provide a work flow process with the team.

Often, I'm asked in the interview process, to do a mock work assignment, to address my knowledge, skill and turn-around time. Those assignments that I found, credit worthy I have indicated and shared on this page.


  • Develop problem statement to formulate task and task objectives.
  • Develop objectives of project.
  • Establish success metrics.
  • Define the audience.
  • Establish use cases.
  • Set site goals.
  • Complete competitive analysis
  • Complete Hueristic Evaluation of current system.
  • Complete Cognitive Analysis of current system.
  • Conduct Architecture Analysis of current system.
  • Analyze content inventory.
  • Conduct Qualitative Analysis
  • Create Affinity Diagram
  • Code qualitative analysis to find commonalities.
  • Create concept map showing systems concept and their relationship with each other and the user.
  • Create process flow chart of current system to analyze with user's nature task flow process.
  • Develop systems site map to compare with user's nature task flow process.
  • Develop observation design to test current system.
  • Develop task list
  • Develop task steps for each task list to measure system to user's natural task flow.


  • Write permission observation script.
  • Write task script.
  • Develop measure of success criteria.
  • Develop test roles and procedures.
  • Establish quantitative and qualitative measures.
  • Create materials and equipment list for observation, interview or survey.
  • Develop followup interview questions for each task.
  • Develop survey questions
  • Determine method of conducting survery.
  • Online survey
  • In person survey
  • Telephone survey
  • Develop persona designs based upon qualitative analysis.
  • Develop wireframes based upon HCI research findings.
  • Create visual design boards to present to development team.
  • Create low fidelity prototype to test new system with user.
  • Create high fidelity mockup to test new design with user.
  • Conduct second observation and interview with user.
  • Prepare documentation for stakeholders.
  • Present documentation of findings to stakeholders.

Discovery, Strategy, Design and Execution Project Phase System using Trello

Resume Capture UI Design

Interview Assignment Timeframe: Two Weeks

Submission Timeframe: One Week

Rapid Resume Logo

Click on image to view full process.

HCI Research Project Proposal

Project Proposal 1 of 3 - Call In Transition Project

Interview Assignment Timeframe: Two Weeks

Submission Timeframe: 24 hours

Click on image to view full proposal.

Project Proposals 1 of 3

Project Proposal 2 of 3 - Redesign Approval Project

Interview Assignment Timeframe: Two Weeks

Submission Timeframe: Two Days

Click on image to view full proposal.


Project Proposals 2 of 3

Project Proposal 3 of 3 - Employee Relations Project

Interview Assignment Timeframe: Two Weeks

Submission Timeframe: Three Days

Click on image to view full proposal.

Project Proposals 3 of 3

Affinity Diagram

Organizing large amounts of language data.

Affinity diagrams help organize large amounts of language data to find commonalities. These assist with brainstorming ways to find the user's normal task flow. Affinity diagrams can be used with team brainstorming sessions or after conducting multiple observations, interviews or a survey.

My affinity diagrams can be as simple as colored sticky notes on a wall when working in a team environment or as complex as creating one electronically after conducting several observations or interviews.

Affinity Diagram

Click on image to expand.

Heuristic Evaluation

Identification of usability issues.

The Heuristic Evaluation was established by Jakob Nielsen in 1995. This evaluation puts the evaluator in a user mindset and asks ten critical questions about the system.

When I complete a Heuristic Evaluation, I begin with gaining answer to three questions that will then guide the evaluation. I may be asked to evaluate the entire system, or just one task in the system. The time frame is dependent upon the depth of the system evaluation. It can be as little as an hour or can take several days.

What is the goal of the system?
Who is the target user?
What task in the system will be evaluated?

Once these three questions have been defined, I can begin the system evaluation. This process involves answering the following questions which ultimately answer if the user will obtain positive user experience when interacting with the system.

  1. Viability of the System Status

    Does the system provide the user with it's current status?

  2. Match Between System and Real World

    Does the system match the users natural task flow?

  3. User Control and Freedom

    Does the system provide the user with a path that is easy for the user to follow?

  4. Consistency and Standards

    Does the system provide the user with consistency so the user doesn't have to guess the system's meaning or task procedure?

  1. Error Prevention

    Is the system design to prevent user error?

    Does the system provide assistance to the user should they incur an error?

  2. Recognition Rather than Recall

    Does the system provide the user with easy an easy recognize path rather than requiring the user to have to recall how to navigate to perform task?

  3. Flexibility and Efficiency of Use

    Does the system provide the user with flexibility in performing task to ensure optimal efficiency?

  4. Aesthetic and Minimalist Design

    Is the system aesthetically pleasing to the user?

    Is the system's design minimalistic so as not to be cluttered to the user?

  5. Help Users Recognize, Diagnose, and Recover from Errors

    Does the system provide the user with a method to easily recognize when they have made an error?

    Does the system provide the user with information on what the error is?

    Does the system provide the user with information on how to correct the error?

  6. Help and Documentation

    Does the system provide the user with easy access to help information?

    Does the system provide the user with easy access to other important documentation?

Cognitive Walk Through

Analyzing the User Interface of a System.

A Cognitive Walkthrough analyzes the user interface to determine if the interface matches the user's normal task flow patterns.

When I am completing a Cognitive Walkthrough of a system, I define the same answers that I asked for a Heuristic Evaluation. Once these questions have been answered, I begin step by step analyzing the user interface to ensure that it provides the user with the ability to efficiently accomplish the defined task.

What is the goal of the system?
Who is the target user?
What task in the system will be evaluated?

Once these three questions have been defined, I can begin the system evaluation. This process involves answering the following questions which ultimately answer if the user will obtain positive user experience when interacting with the system. I provide a brief sample of my process. This particular walkthrough was done on three tasks within a system. I analyzed 174 steps going through each of the four question for a total of almost 700 touch points that I analyzed to provide recommendations to the system.

  1. Is the effect of the current action the same as the user's goal?
  2. Is the action visible?
  3. Will user recognize action as the right one?
  4. Will user understand feedback?
Cognitive Walkthrough

Click on image to expand.

Usability Testing Platform

Developing Usability Testing Procedures

The development of usability testing procedures follows an in-depth platform designed to draw out the desired end results. A survey question of, "What is the top five tasks you perform?" will assist in narrowing down what usability testing should be performed.

A key component of the usability testing procedure is in the de-briefing questions. Asking the user, "What is one thing you would improve?" allows analysis using the Pareto Principle, also known as the 80/20 rule. This one question will provide a statistic of what 20% of the systems tasks create 80% of the user's frustration.

This platform can be used for remote and live observation testing. It can also be applied for surveys and interviews.

  1. Task name

  2. Task instruction script

    Instructing the user without prejudicing the upcoming task.
  3. Task metrics

    Defining the method of measurement for the task. e.g. Quantitative or qualitative measurements.
  4. Success metrics

    Defining the measurement to determine the threshold of success. Quantitative: How long did it take to find the login button?, Qualitative: Facial expressions, sounds, gestures.
  5. Benchmark

    Quantitative number which is applied to the success metrics. e.g. < 30 seconds equates to task success, > 30 seconds equates to task failure.
  6. Prioritization

    Establishing key points to observe, can be quantitative or qualitative. e.g. Facial expression, time on task, eye's focus on screen.
  7. Debriefing questions

    Ensuring that each user is debriefed in the same manner to ensure cohesive categorical data analysis.

Qualitative Analysis

Examination of non-measurable language data.

Qualitative Analysis is the examination of non-measurable data. This analysis is used to determine commonalities amongst user's. This process can occur after an observation, interview or survey. The qualitative measure is the language the user provided in the observation or followup interview. This is taken and organized into categories to find commonalities. Once categories have been found, then a quantitative analysis can occur. e.g. Observing 50 individual completing Task 1, 76% of the individuals stated they were confused in the followup interview.

Stake holders require quantitative data to formulate their decision. When I conduct a qualitative analysis, I understand the process of analyzing this data to obtain the quantitative measures that stake holders will need.

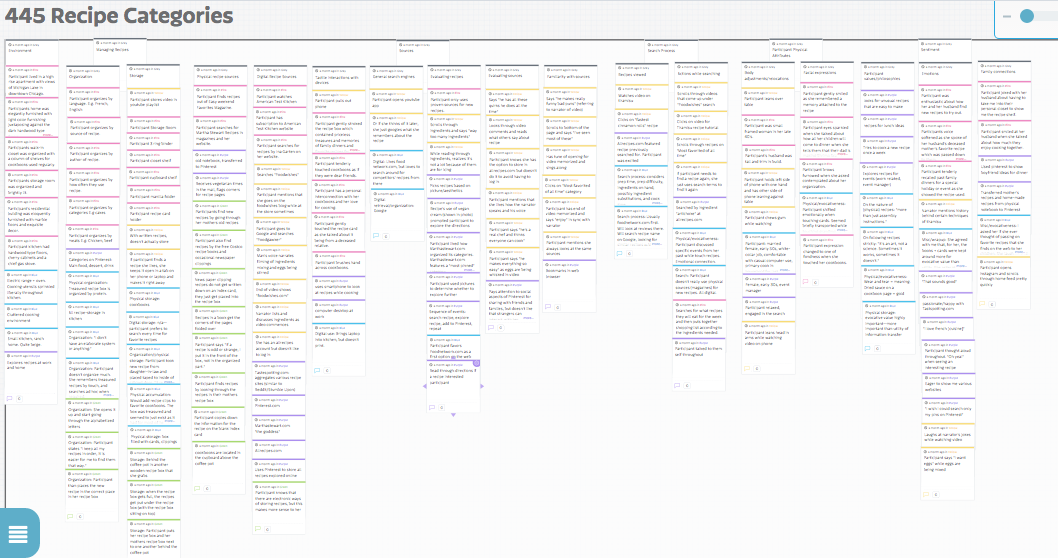
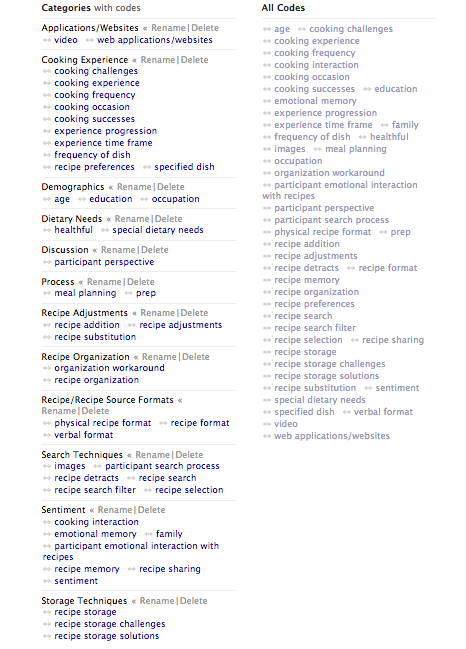
The qualitative analysis coding shows how individuals search and organize their recipies. How is this information helpful? By analysing the language in the observation and interview, I was able to analyze if there was a correlation between age and searching for recipes through print or online sources. Since cooking is in part attributed to an emotional memory or experience, my analysis was able to uncover that an emotional attachment can be attached to both print and electronic recipes.

What is the benefit of my research? My analysis assists the in the devopment of a website or app, that will assist in creating an emotional attachment for the user and developing online organization systems for the recipes. My research also benefits the marketing team in development of online advertising to create an emotional response to lead the user to the recipe website.

Saturate Coding

Click on image to expand.

Statistical Analysis

Where Qualitative become Quantitative

Qualitative data can be gathered through observation, interview and survey. This verbal data has to be converted into statistical data to be analyzed. For demonstrative purposes I am going to test two systems to find which system had the highest learnability rating. To do this test I wanted a combination of a prototype and survey to take place utilizing System Usability Scale (SUS) questions. These 10 questions provide a measure for further statistical testing. The succeeding sections will demonstrate how this is done.

For the sake a statistical testing, I will also show how to take this data in SPSS and do statistical analysis.

For demonstration purposes I have mocked up a demo using Google survey on how this can be achieved. As shown here, you can embed a workable form into your website for your user's to test. Fill free to complete the form.

Click inside the form for the form's scroll bar to appear.

SUS Data Analysis

Data Conversion Process

As seen in the Google Survey, I used the 10 SUS question for each system. This will allow me to compare the two systems using both SUS and SPSS analysis methods. Google Survey will provide you an excel spreadsheet with the quantitative wording. Taking that spreadsheet into excel and using find and replace you can easily replace the quantitative wording with the SUS analysis numbers.

  1. I think that I would like to use this system frequently.
  2. I found the system unnecessarily complex.
  3. I thought the system was easy to use.
  4. I think that I would need the support of a technical person to be able to use this system.
  5. I found the various functions in this system were well integrated.
  6. I thought there was too much inconsistency in this system.
  7. I would imagine that most people would learn to use this system very quickly.
  8. I found the system very cumbersome to use.
  9. I felt very confident using the system.
  10. I needed to learn a lot of things before I could get going with this system.

As you can see by reviewing the questions, the odd number questions are positive and the even number questions are negative.

  1. Subtract 1 from the odd number question responses. e.g. response - 1 = x
  2. Subtract 5 from the even number question responses. e.g. response - 5 = x
  3. Add up all the user's modified numbers and multiply by 2.5.
  4. Take the number from above and calculate the average. This gives you a score, not a percentage.

An average SUS score is 68. Any number above this score is above average in usability. Anything lower than 68 is below average. Based upon these calculations, System 1 received 53, which is below average. System 2 recieved a score of 79, which is above average.

With these two numbers, I can give a letter grade to each system using a bell grading curve. System 1 with a score of 53 recieves a D+ letter grade. System 2 with a score of 79 receives a B+ letter grade. While a B+ is significantly higher than a D+, further study on System 2 is needed to provide optimal user experience.

SUS Likert scale rating system

Report and Presentation

Delivery of findings and recommendations.

Delivery of findings and recommendations can be presented in print or visual display depending up the stake holders preference. Print allows for in-depth detail of the process. Print can also be presented with just the findings and recommendations.

Visual delivering can be presented in a power point type presentation or through video. My reports and presentations vary based upon the audience and directives I am provided. A combination of visual and print can provide a pleasant reporting experience for the stake holders.

Stake holders rarely have the opportunity to meet the user. Presenting findings and recommendations from the user's perspective provides the stake holders with their target audiences perspective. The video provides a sample of how this can be achieved. Following the video, a formal print brief of recommendations would be distributed and discussed.

Contributions

I enjoy working individually or in a team environment. The visual and print documentation is from one of my MS HCI projects. Corporate reports and presentations are proprietary and can't be shared.

Carin Camen

  • Personas
  • Wireframes
  • Visual Flatboards
  • Low fidelity prototype using OmniGraffle
  • High fidelity prototype using AXURE
  • Video script copy
  • Presentation audio/visuals
  • Final project document

Lindsay Callahan

  • Project proposal
  • Card sort and participant recruitment
  • Information architecture analysis
  • Presentation visuals
  • Final project document

Leilani Johnson

  • Project plan
  • Content inventory
  • Wireframes
  • Task flows
  • Presentation audio/visuals
  • Final project document

David Boston

  • Site map
  • Wireframes
  • Video production
  • Video animations
  • Presentation audio/visuals
  • Final video production
  • Final project document

Nathan Strumfeld

  • Wireframes
  • Competitive Analysis
  • Logo
  • Presentation audio/visuals
  • Final project document

Alma Sandoval

  • Personas
  • Task flows
  • Presentation audio/visuals
  • Final project document